What is Environmental DNA?
Data presented in this atlas were obtained using a method known as environmental DNA metabarcoding (eDNA-M). Because understanding this method is essential to evaluate the reliability of the data, we provide an explanation below.

DNA released by organisms into their surrounding environment is collectively referred to as environmental DNA (eDNA). Naturally, this eDNA is unique to the organisms that released it. By collecting eDNA, determining its nucleotide sequence, and comparing that sequence with reference sequences from known organisms, it is possible to identify the species that released the DNA. This approach is known as eDNA analysis. eDNA metabarcoding (eDNA-M), in particular, has the advantage of simultaneously identifying and analyzing multiple groups of organisms.
The eDNA-M method can be applied to a wide variety of organisms, ranging from bacteria to higher animals. Among these, applications to fishes are particularly advanced (for example, Biodiversity Center of Japan, Ministry of the Environment / Environmental DNA Surveys). One reason is that a large amount of genetic sequence information has already been accumulated for fish eDNA. Another is the strong demand for information on what fish species inhabit particular marine and freshwater environments. However, when fish move between habitats, interpreting eDNA results becomes more difficult.
Corals, on the other hand, are among the organisms for which eDNA-M can be used particularly efficiently. The first reason is that most corals are sessile and remain attached to rocks or other substrates. Therefore, corals releasing environmental DNA are generally located near the site where seawater samples are collected. Second, corals continuously secrete large amounts of mucus, which contains substantial quantities of environmental DNA. Because this mucus is relatively light, it tends to accumulate near the sea surface. By collecting surface seawater above a coral reef and analyzing the eDNA it contains, it is possible to detect and identify the corals inhabiting the reef below (Fig. 1).
To date, approximately 83 genera and 400 species of zooxanthellate scleractinian corals have been recorded in Japan (genera and species are taxonomic categories). Our research group at OIST, in collaboration with researchers at the University of Tokyo and other institutions, developed a system called Scl-eDNA-M-JPN capable of detecting and identifying all of these genera and species. DNA consists of four nucleotide bases—adenine (A), thymine (T), guanine (G), and cytosine (C)—and the sequence of these bases differs among species. The eDNA-M method relies on amplifying eDNA using PCR (polymerase chain reaction), determining its nucleotide sequence, and comparing sequence differences among taxa. In the Scl-eDNA-M-JPN system, we identified a region in the mitochondrial 12S rDNA of zooxanthellate scleractinian corals in which a sequence of 366–465 base pairs differs among genera (allowing genus-level discrimination; See the central portion of Fig. 2). At the same time, we found that the flanking regions at both ends (approximately 20 base pairs each) are highly conserved across genera. By using these conserved regions as PCR primers (Scle-12S-Fwd and Scle-12S-Rv), environmental DNA can be amplified, and resulting sequences (called amplicons) can be compared to identify coral genera from which the eDNA originated (see Shinzato et al. 2021).
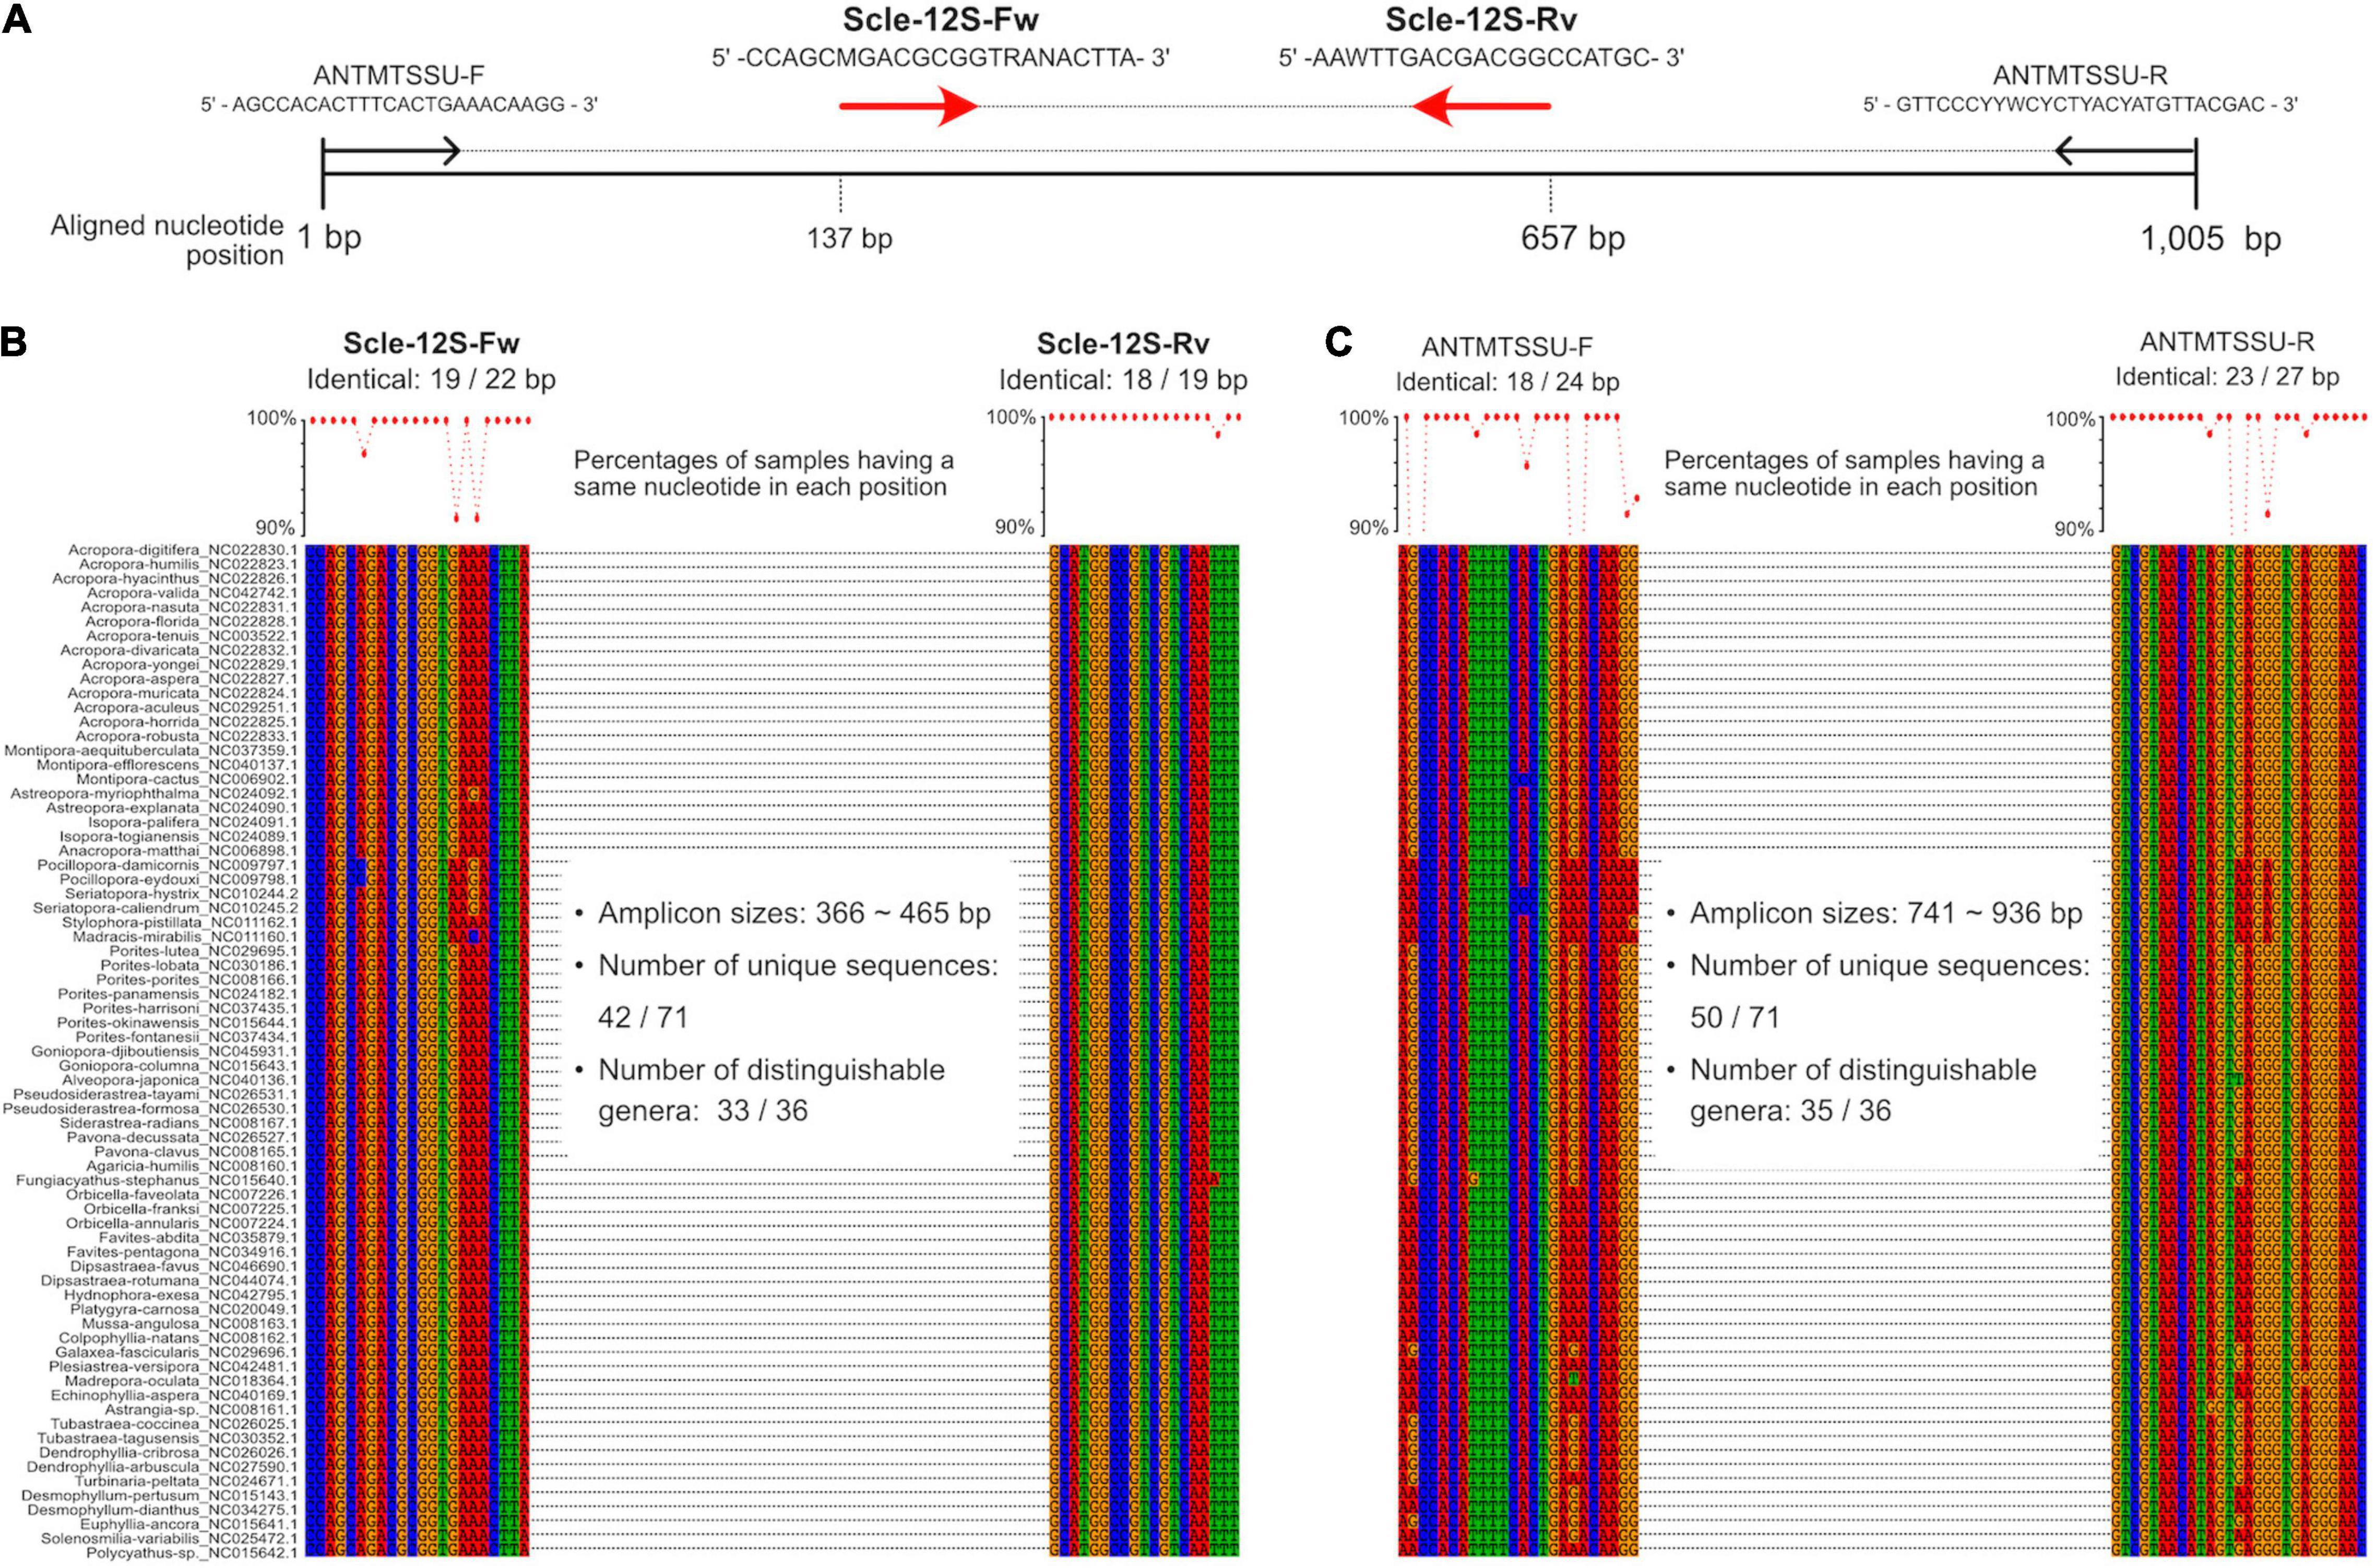
For example, suppose that a coral reef contains 50 coral genera. Each of these genera possesses a characteristic amplicon sequence. After determining the amplicon sequences of coral eDNA contained in surface seawater, we use highly accurate diversity-analysis methods known as ZOTUs (Zero-radius Operational Taxonomic Units) or ASVs (Amplicon Sequence Variants) to determine how many sequences correspond to each of these 50 genera. If the number of ZOTUs corresponding to a particular genus exceeds 100, this suggests that corals of that genus are present on the reef. Conversely, if the ZOTU count is zero or extremely low, it suggests that the genus may be absent. Furthermore, if Genus A has 10,000 ZOTUs while Genus B has 500, this indicates that colonies of Genus A are likely much more abundant than those of Genus B on that reef. Using this approach, we surveyed all 62 sites around Okinawa Island and present, for each site, the top 10 coral genera inferred to be most abundant. Complete ZOTU data for all 83 coral genera can be accessed from the page for each site. Finally, we summarize the dominant genus at each site in island-wide distribution maps.
In the coral component of the Monitoring Sites 1000 Project organized by the Ministry of the Environment, the primary objective is to compare coral reef health among sites and across years. Therefore, coral cover is one of the most important survey metrics. As a result, these surveys do not necessarily provide taxonomically detailed ecological assessments of corals. Our method identifies corals at the generic level rather than the species level. Coral genera presented in this atlas are determined using a taxonomically robust approach based on DNA sequence comparisons. These results correspond closely with those obtained from conventional visual surveys (Nishitsuji et al., 2023). If a taxonomically recognized coral genus is present on a reef, it can generally be detected and identified with high confidence.
Nevertheless, the Scl-eDNA-M-JPN method has several limitations. One limitation is that although zooxanthellate scleractinian corals inhabiting shallow reefs down to approximately 15–20 m depth can be detected and identified effectively, detection efficiency declines with increasing depth. The reason for this remains unclear. To address this issue, we collaborated with researchers from NTT DOCOMO to develop a method for surveying coral ecosystems deeper than 30 m by collecting seawater samples using underwater drones. For details, please refer to the section entitled “Mesophotic Coral Environmental DNA.”
A second limitation is that while the method can determine whether a coral genus is present, it cannot yet perfectly quantify relative abundances among genera. To fully resolve this issue, it would be necessary to demonstrate that all coral genera release eDNA at equivalent rates. Our studies indicate that eDNA release rates are broadly similar among coral genera, and eDNA results correspond closely with visual survey results. A third limitation is that coral cover—the proportion of the substrate occupied by living corals—is an important metric for understanding reef condition. At present, eDNA metabarcoding cannot directly estimate coral cover.
Although several challenges remain, the data generated by the Scl-eDNA-M-JPN method already provide valuable insights into the current status of coral reefs throughout the Ryukyu Archipelago. Residents of each island can readily learn which coral genera occur around their local reefs. Moreover, different people may interpret these data from different perspectives, potentially revealing new and diverse aspects of coral reef ecology.
Related Publications
- Shinzato et al. (2021). Novel mitochondrial DNA markers for Scleractinian corals and generic-level environmental DNA metabarcoding. Front. Mar. Sci. 8:758207.[LINK]
- Nishitsuji et al. (2023). An environmental DNA metabarcoding survey reveals generic-level occurrence of scleractinian corals at reef slopes of Okinawa Island. Proc. Roy. Soc. B 290: 20230026.[LINK]
- Hisata et al. (2025). An eDNA metabarcoding system for detecting scleractinian corals to the generic level along the Japanese coast. Galaxea 27:13–27. [LINK]
- Okada, N., Shimizu, Y., Nagahama, S., Nishitsuji, M., Narisoko, H., & Satoh, N. Exploration of mesophotic coral ecosystems using underwater drones and environmental DNA methods. Journal of the Japanese Coral Reef Society, 2024, Vol. 26, No. 1, pp. 81–88. [LINK]
- Minamoto T, Miya M, Sado T, Seino S, Doi H, Kondoh M, et al. (2021) An illustrated manual for environmental DNA research: water sampling guidelines and experimental protocols. Environ DNA 3: 8–13 [LINK]
Workflow of Coral Environmental DNA Analysis
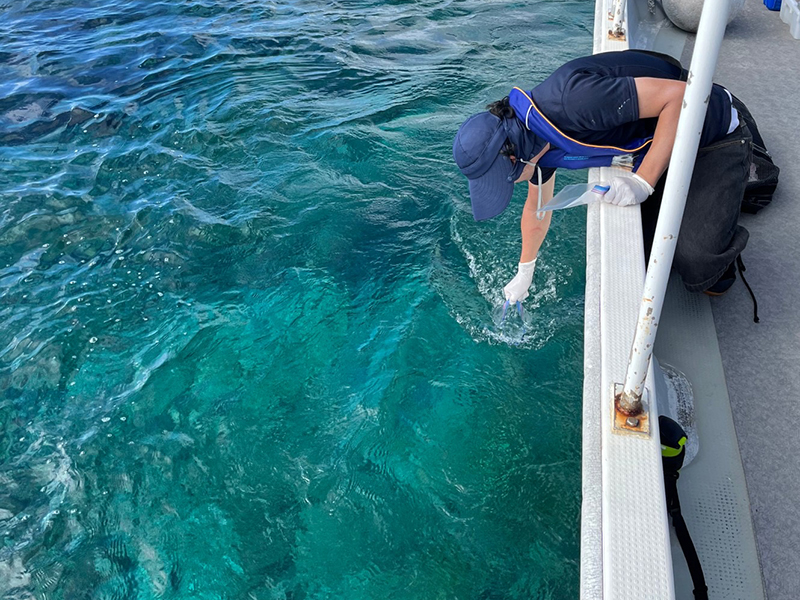
① Water Sampling
Surface seawater is collected. Sampled water contains eDNA released from corals, fish, and other organisms living in coral reef ecosystems.
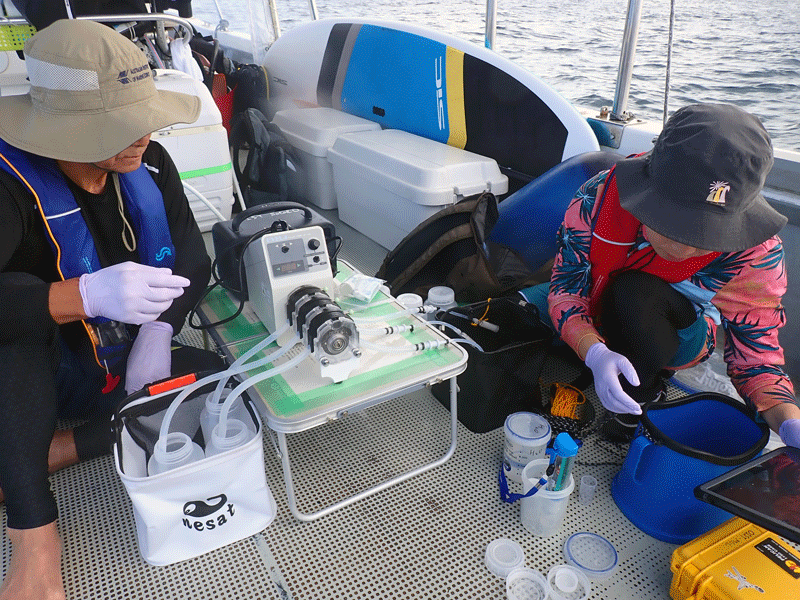
② Filtration
A collected sample is filtered as quickly as possible to capture and preserve eDNA on a filter (to prevent degradation).
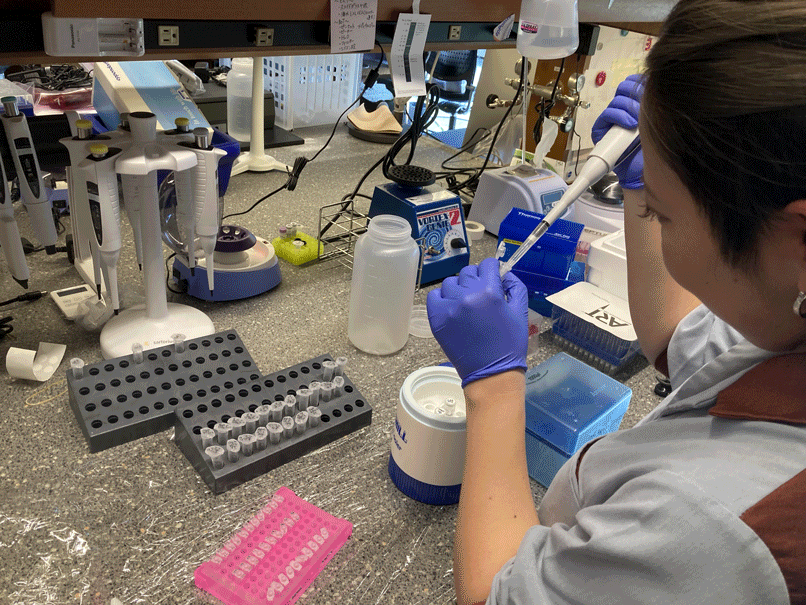
③ eDNA Extraction
Captured eDNA is extracted from the filter. The extracted eDNA is then used for analysis.
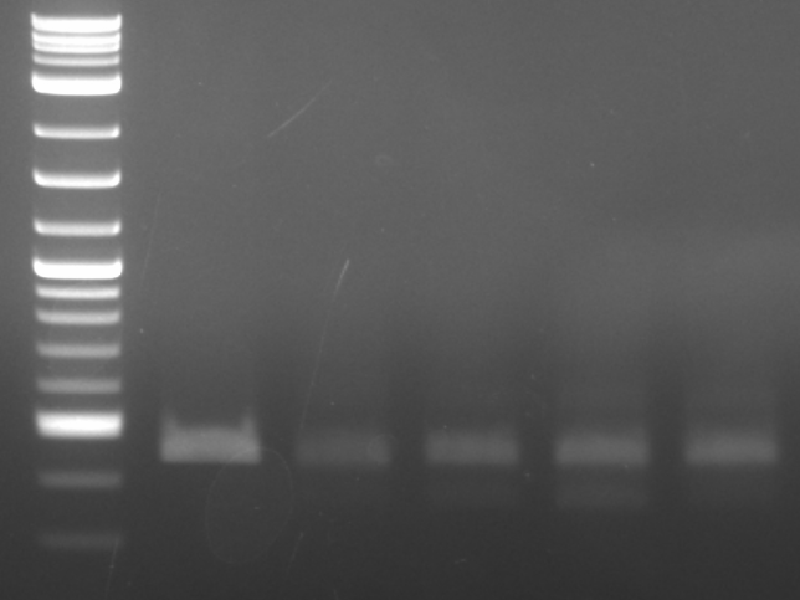
④ PCR Amplification
A portion of the mtDNA 12S rDNA gene is amplified using PCR. Amplification is confirmed by electrophoresis, and a cDNA library is prepared. Faint DNA bands can be seen in the five lanes on the right, while the left lane shows marker DNA.
⑤ Sequencing and Analysis
Nucleotide sequences of eDNA are determined using a next-generation sequencer. Resulting sequences are analyzed computationally to determine which coral genera are present and their relative abundances.